


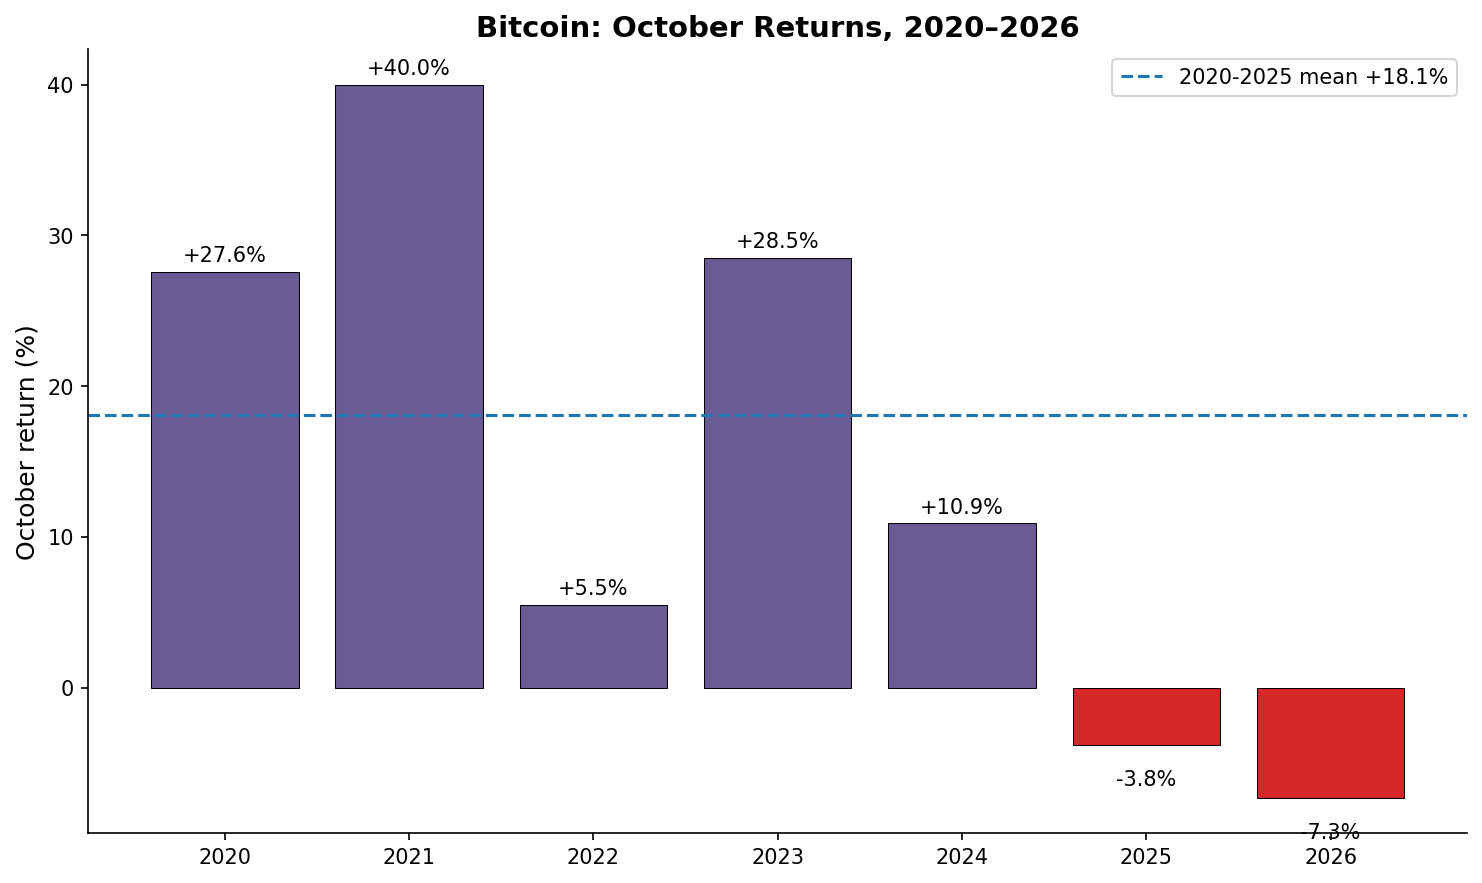
On 25 October 2026, Bitcoin sat at $80,051. It had closed September at $83,567. That put the month at −4.2 percent with a week still left to run—against a +18.1 percent average October return since 2020. By the final close, the damage had deepened. Multiple price trackers put the end-of-month print near $77,430, a roughly 7.3 percent decline for the full month. For a period the market had long treated as Bitcoin’s most reliable seasonal tailwind, the result was not merely a miss. It was the second consecutive red October and the weakest in CryptoQuant’s sample stretching back to 2020.
The nickname “Uptober” rested on a simple record. Every October from 2020 through 2024 finished positive, with gains ranging from +5.5 percent to +40.0 percent. The mean was +18.1 percent; the median +19.2 percent. October 2025 broke the streak at −3.8 percent. October 2026 made it two in a row and extended the underperformance. The calendar itself did not change. What changed was the balance of demand and the thinness of the on-chain cushion that had absorbed earlier dips.
Why the seasonal pattern broke
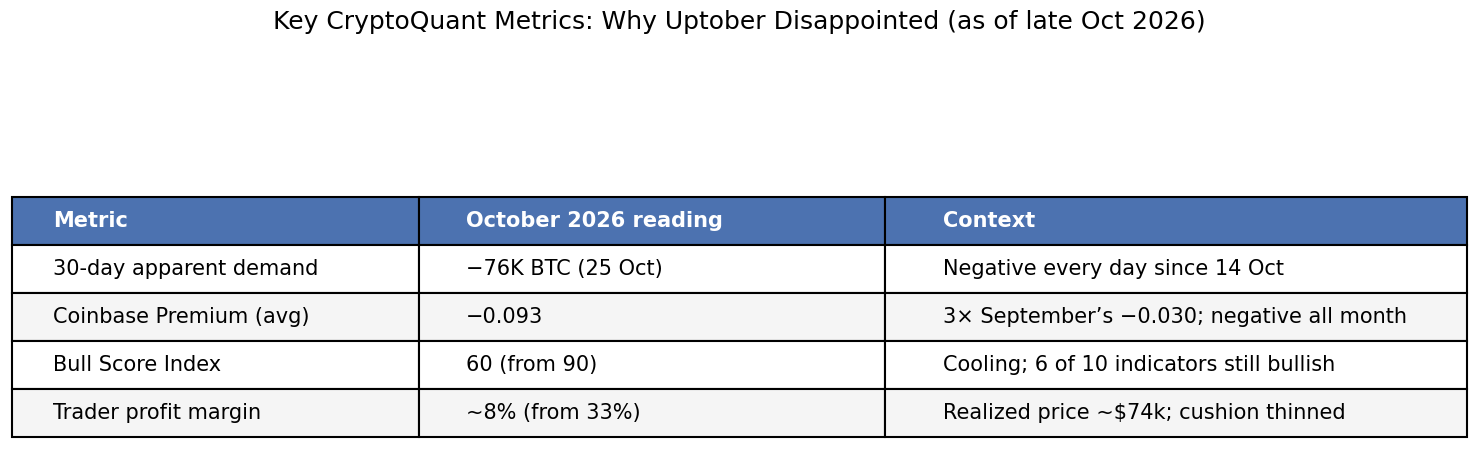
CryptoQuant’s 27 October research note, “Why Uptober Disappointed,” framed the miss in two linked observations: U.S. demand faded while the on-chain cushion stayed thin. Overall spot demand turned negative every day from 14 October onward. The 30-day sum of apparent demand stood at −76,000 BTC on 25 October. New holders were absorbing coins more slowly than new issuance was entering circulation. The brief positive run in late September had reversed.
U.S. buyers, in particular, stayed on the sidelines. The Coinbase Premium—the gap between Coinbase’s BTC/USD price and the offshore BTC/USDT market—remained negative on every day of October. It fell to −0.146 on 24 October, its lowest reading since 30 June. The month’s average of −0.093 was three times September’s −0.030. U.S. spot buyers were consistently paying less than the offshore market. Later readings pushed the premium even lower; by the end of the month it had touched levels not seen since the immediate aftermath of the FTX collapse in November 2022.
The cushion that had limited earlier downside also thinned. CryptoQuant’s Bull Score Index cooled from 90 (extra bullish) in late September and early October to 60 by mid-to-late October. Six of ten indicators remained bullish, so the regime was still described as “bullish, cooling,” not outright bearish. But the shift mattered. Traders’ unrealized profit margin compressed sharply. The gap between spot price and the trader realized price (coins held one to three months) had peaked at 33.4 percent on 22 September. By 26 October it stood at 8.1 percent, with the realized price near $74,041. The profit buffer that had previously absorbed selling had largely evaporated.
These on-chain readings sat against a macro backdrop that offered little relief. September CPI came in hotter than expected. The Federal Reserve’s 27–28 October meeting produced a hold on the federal funds rate at 3.75–4 percent, approved 10–2. Two officials dissented in favor of a further 25-basis-point hike. Inflation remained elevated; the statement emphasized the need for more information before determining the appropriate stance. Bitcoin’s largest daily move of the month occurred on 29 October, a roughly 4.3 percent drop that coincided with the release of GDP and PCE data.
The stablecoin supply contraction
While spot demand for Bitcoin weakened, the broader pool of on-chain dollars was also shrinking. Glassnode reported that total stablecoin supply fell by $14.2 billion over the 30 days ending around 9–11 November 2026—the steepest 30-day contraction since June 2022. DefiLlama-based readings around mid-November placed USD-pegged supply in the $280–290 billion range, down roughly 7–8 percent from its mid-May 2026 peak near $312.85 billion. USDT and USDC accounted for the bulk of the decline; CryptoQuant separately noted that USDT’s market capitalization had fallen $6.6 billion over the 60 days through 7 November, more than double the drop recorded in a comparable window after the FTX collapse.
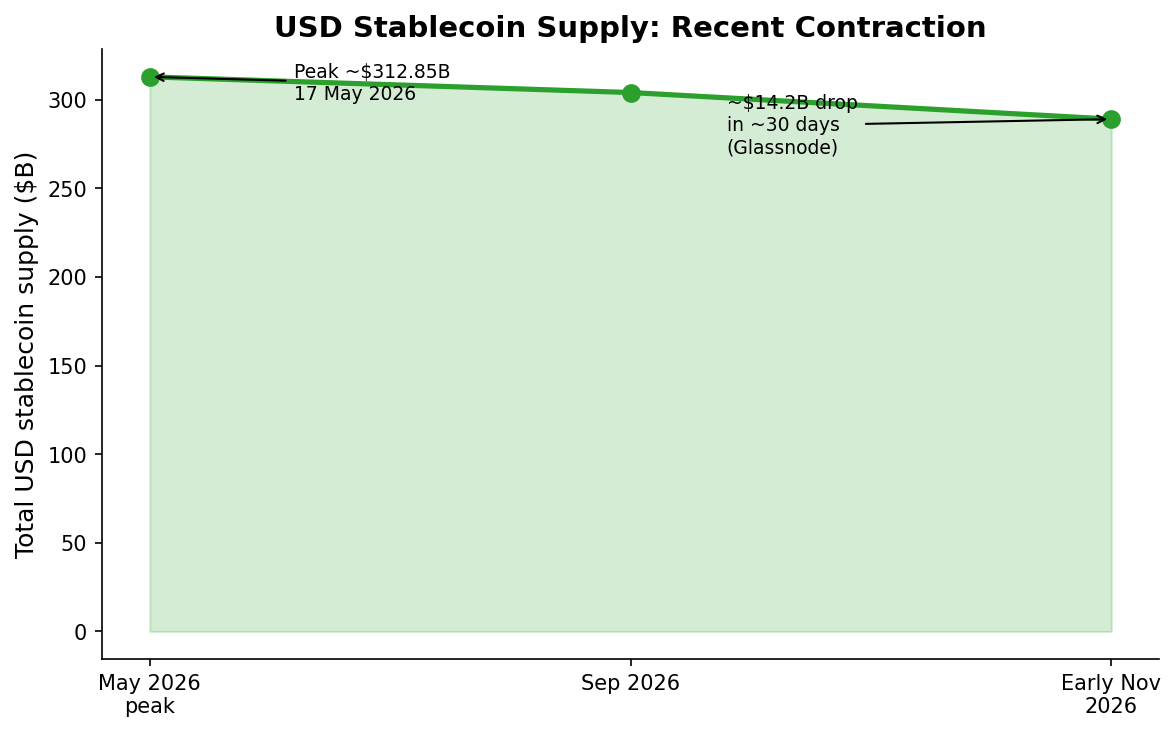
Stablecoins function as the primary settlement and collateral layer inside crypto markets. When their supply contracts, it typically reflects redemptions into fiat and capital leaving the ecosystem. Glassnode’s commentary was direct: holders were “taking that cash out of the market,” leaving less fuel for a rally. The 30-day change turning back to positive growth would be the first clear sign that new money was entering again. As of mid-November 2026, that signal had not arrived. The contraction continued a pattern that had already been visible through much of the second half of the year, even as measured stablecoin payment volumes had risen earlier in 2026.
Post-midterms policy outlook
The U.S. midterm elections on 3 November 2026 produced a Democratic sweep of both the House and the Senate. Democrats gained control of key committees that oversee financial services and digital assets. The market-structure bill that had advanced in the House earlier in the cycle (often referenced as the Clarity Act or similar legislation) had already failed to clear a procedural vote in the Senate in September. With the new Congress, the near-term path for comprehensive market-structure legislation narrowed further. Analysts and reporting at the time noted that Democratic control would likely prioritize oversight and investigations—particularly around potential conflicts involving the administration’s crypto-related activities—over advancing industry-preferred bills.
Agency rulemaking continues regardless of which party holds Congress. The GENIUS Act on stablecoins had already become law in 2025. The SEC and CFTC retained existing authorities and had begun developing frameworks for custody, tokenized securities, and market structure. A stalled legislative vehicle does not freeze all progress, but it removes the most direct route to statutory clarity that many market participants had priced. For year-end liquidity, the immediate effect is less about new statutes and more about the absence of a positive policy catalyst and the presence of heightened scrutiny that can keep some institutional flows cautious.
What supports or weakens the liquidity cushion into year-end
The liquidity cushion available to absorb selling or to fund new positioning is not a single number. It is the interaction of three observable flows: spot demand (especially U.S.-based), the size and direction of stablecoin supply, and the residual profit buffer among recent buyers.
What currently weakens it is straightforward. Apparent spot demand has been negative. The Coinbase Premium has stayed negative, indicating that the largest regulated U.S. venue is not leading. Stablecoin supply is contracting at its fastest 30-day pace since the 2022 bear market. The short-term holder profit cushion has compressed from more than 30 percent to single digits. Each of these reduces the marginal dollar available to buy dips or to roll into year-end positioning without requiring fresh external capital.
What would support it is equally observable. A sustained return of the 30-day apparent demand series to positive territory would show that new buyers are once again absorbing issuance. A Coinbase Premium that flips and stays positive would indicate U.S. spot buyers are willing to pay a premium again. Stablecoin supply that stops contracting and begins to expand—even modestly—would signal that redemptions have slowed and that new dollars are being deposited into the ecosystem. A recovery in the Bull Score Index toward the higher readings seen in late September, or a re-widening of the short-term holder profit margin, would show that the on-chain cushion is rebuilding. None of these are price targets; they are flow indicators that historically precede periods in which dips are more readily absorbed.
The Federal Reserve’s path remains a background variable. The October hold left rates at 3.75–4 percent with two dissents for a hike. Further data on inflation and growth will shape the December meeting. Crypto markets have historically been sensitive to the trajectory of dollar liquidity and real yields more than to any single calendar month. A policy stance that keeps real yields elevated tends to weigh on risk assets; a shift that eases financial conditions tends to support them. The midterm result does not change the Fed’s independence, but it does change the political environment in which any future legislation or oversight occurs.
Near-term indicators and triggers
The most direct near-term signals are already being published daily or weekly by on-chain analytics firms.
- Stablecoin 30-day supply change. Glassnode and others have flagged a return to positive growth as the earliest practical sign that capital is re-entering. Continued contraction keeps the “dry powder” gauge low.
- Coinbase Premium. A move back above zero, sustained for more than a few sessions, would reverse the month-long pattern of U.S. underperformance relative to offshore markets.
- Apparent demand and exchange flows. The 30-day sum of apparent demand turning positive, or exchange reserves continuing to decline while spot volume holds, would indicate absorption rather than distribution.
- Bull Score Index and short-term holder metrics. A rebound from the 60 reading toward the 70–90 zone, or a stabilization and expansion of the trader profit margin, would show the cushion is no longer thinning.
- ETF and institutional flow data. U.S. spot Bitcoin ETF flows were mixed to soft through October. Sustained net inflows would provide an independent check on whether regulated demand is returning.
These are not forecasts. They are the observable series that, in prior cycles, have distinguished periods in which liquidity was ample enough to support year-end positioning from periods in which it was not. The October 2026 data set them in a weaker configuration than the historical Uptober average would have implied.
Challenges and risks
The principal risk is that the thin cushion and contracting stablecoin supply persist into a period of seasonal or tax-related selling. Year-end often sees portfolio rebalancing, tax-loss harvesting in jurisdictions where it applies, and reduced risk appetite ahead of the holidays. When the on-chain and stablecoin buffers are already low, those ordinary flows can produce larger price responses than they would in a more liquid environment.
Policy risk is real but secondary for the immediate liquidity picture. Democratic control of Congress raises the probability of oversight hearings and reduces the probability of a market-structure bill in the near term. That environment can keep some institutional allocators cautious even if the underlying economic data improve. It does not, by itself, remove the existing legal rails created by the GENIUS Act or by ongoing agency rulemaking.
Macro risk remains the larger external variable. Inflation that stays elevated, or growth that slows enough to raise recession concerns, would likely keep risk appetite subdued. The October Fed meeting already showed a committee divided on the next move. Markets will price the December decision and the subsequent path.
What the setup means for year-end liquidity
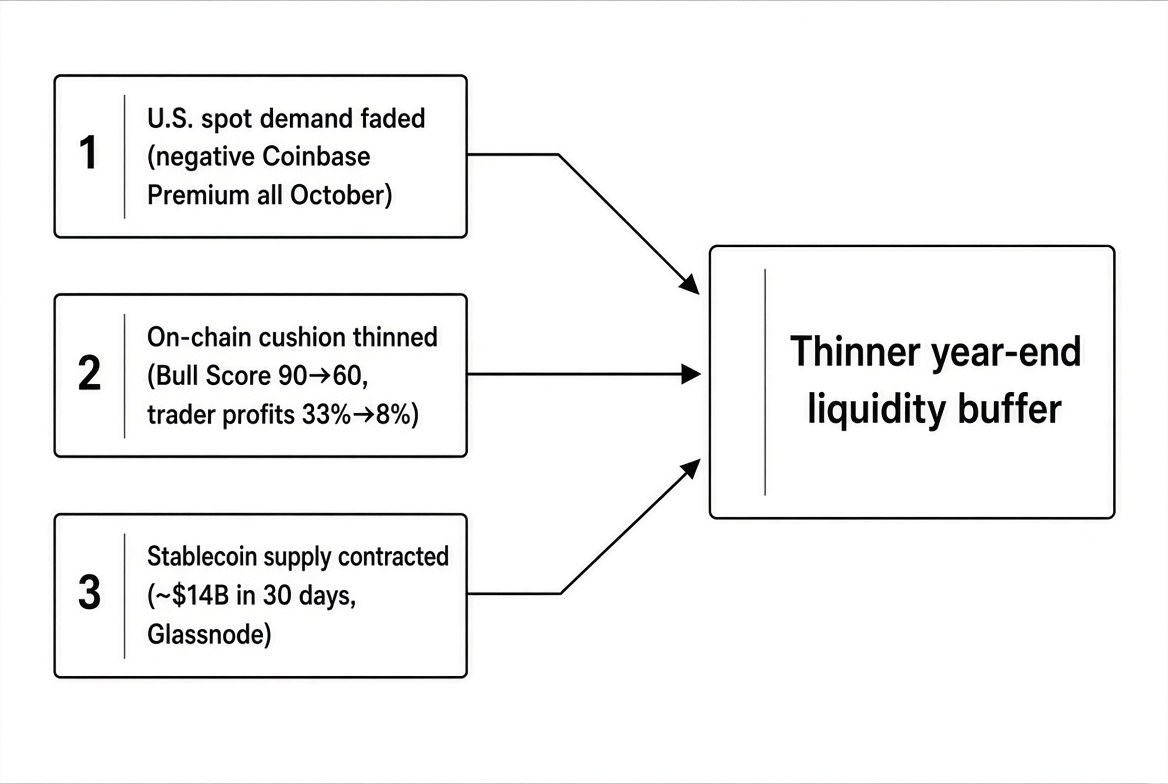
The combination of a second consecutive red October, persistently negative U.S. spot demand, a thinned on-chain profit cushion, and the fastest stablecoin supply contraction since 2022 leaves the market with a thinner liquidity buffer than the historical seasonal pattern would have suggested. Year-end positioning therefore depends more heavily on fresh external capital or on a clear reversal in the existing flow indicators. Absent those, ordinary selling pressure has less natural absorption.
This is not a claim that prices must fall further. It is a description of the conditions under which the market enters the final weeks of the year. The same data that explained why Uptober failed also define the thresholds that would mark a shift. A sustained improvement in apparent demand, a positive Coinbase Premium, and a stabilization or expansion of stablecoin supply would restore some of the cushion that was missing in October. Until those series turn, the liquidity available to support year-end flows remains constrained by the same forces that produced the seasonal miss.
Conclusion
October 2026 did not fail because the calendar changed. It failed because U.S. demand faded and the on-chain cushion that had previously absorbed dips stayed thin, while stablecoin supply contracted at a pace not seen since the 2022 bear market. The post-midterms political landscape adds a layer of reduced legislative tailwind and heightened scrutiny, but the more immediate constraint on year-end liquidity is the flow data itself.
The indicators that would reverse the setup are public and observable. Until they shift, the market enters the final stretch of 2026 with less dry powder than the long-run October average had led many to expect. That is the practical implication of a second red Uptober.
For ongoing coverage of the liquidity and policy developments that shape these markets, subscribe at https://cryptopress.substack.com/subscribe.