


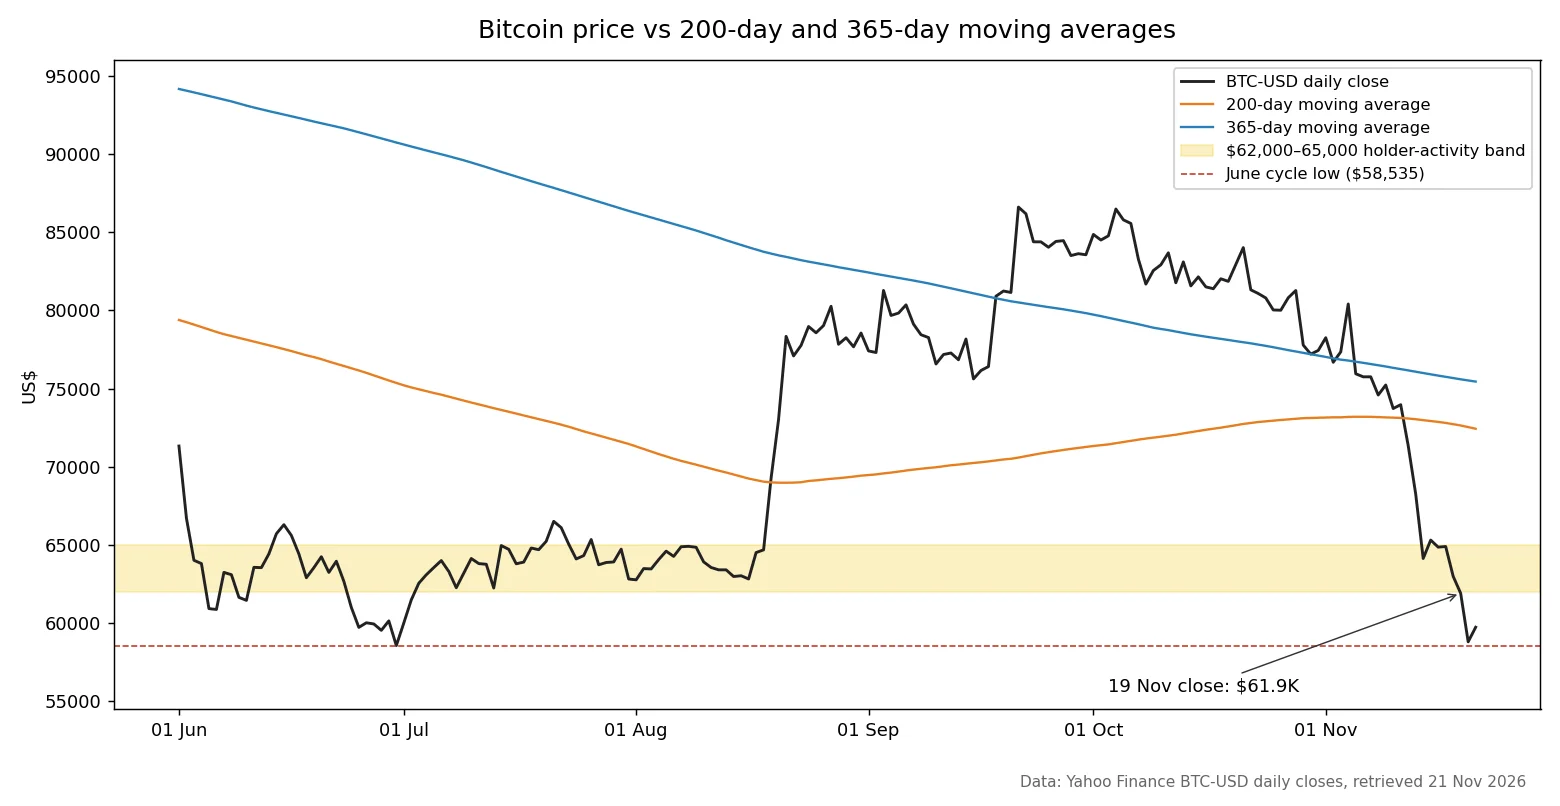
Bitcoin has returned to a bearish phase, but that does not settle whether the decline is a local bottom or the start of a deeper correction. CryptoQuant reported a four-month low near $61,000 and a loss of the rally that began on 19 August. Its 20 November market update puts the 19 November close at $61,915, already below the $62,000-65,000 holder-activity band discussed in its earlier research. Separately, Darkfost’s 19 November CryptoQuant update put apparent demand near -255,000 BTC after a drop below -290,000 BTC. The Bull Score stood at 10 in the 17 November Bear Claw report after reaching zero on 10 November.
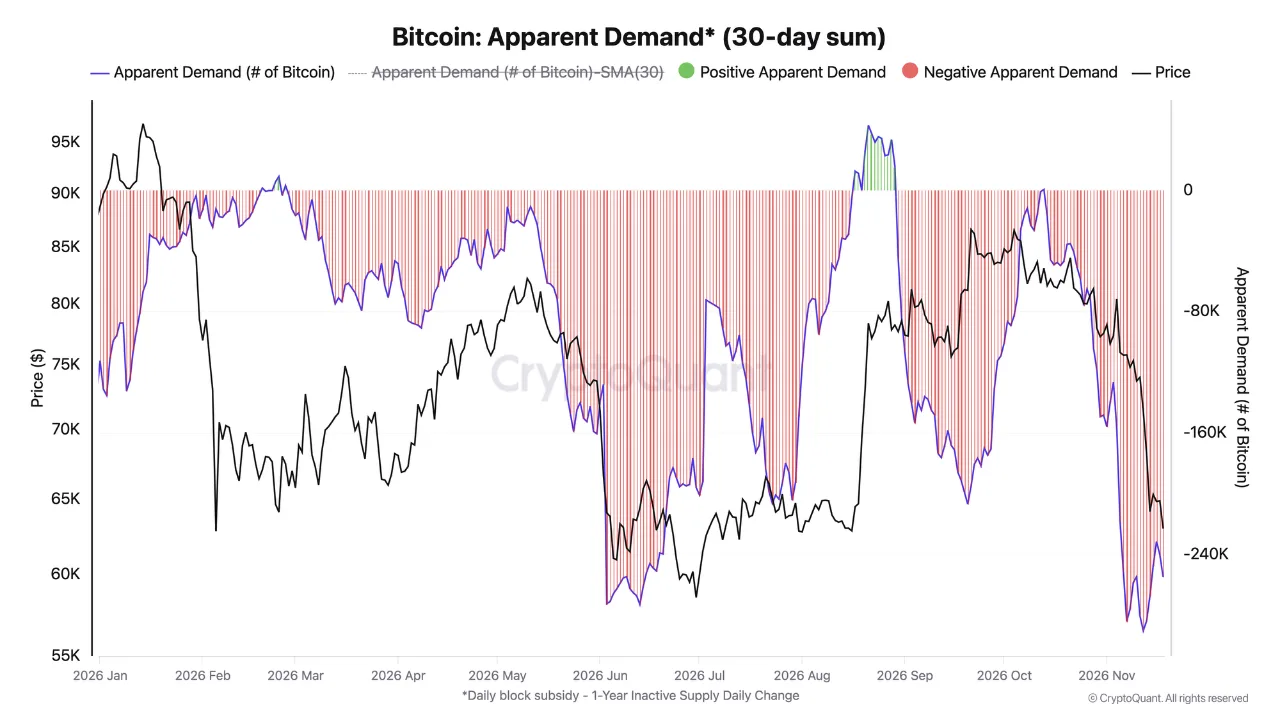
These are not isolated data points. Spot demand led the contraction. Perpetual-futures demand turned negative as leveraged longs were sold and liquidated. Holders realized a net loss of 25,800 BTC on one day, the largest daily reading since 13 July. Traders’ unrealized profit-and-loss margin on coins held one to three months fell to −20 percent, the most negative since 1 July. Analyst consensus, measured by CryptoQuant’s own index, dropped to 58 percent bullish, the lowest since November 2025, per the Bear Claw report.
The simultaneous turn in cycle indicators is the subject of two consecutive CryptoQuant research notes. The 10 November piece, “Razor’s Edge: Local Bottom or Deeper Correction?”, noted that most cycle indicators had flipped bearish at once, exactly the signature of a local bottom such as April 2025, and also the opening phase of a larger drawdown. A week later the 17 November note, “Bear Claw: Bitcoin Returns to a Bearish Phase”, confirmed that price had lost both the 365-day and 200-day moving averages and that demand growth was contracting at its fastest pace since 1 July.
The mechanics of the demand collapse
Apparent demand is an on-chain proxy. It is calculated as the difference between newly issued Bitcoin (the block subsidy) and the change in supply that has remained inactive for more than one year. When the figure is positive, structural accumulation is absorbing new issuance. When it is negative, new coins are entering circulation faster than long-term holders are locking them away.
Darkfost reported apparent demand near -255,000 BTC on 19 November, following a low below -290,000 BTC, against an estimated monthly average of -172,000 BTC. CryptoQuant separately reported that spot demand was leading the contraction and perpetual-futures demand had also turned negative. These are related measures, not interchangeable series: the apparent-demand reading should not be presented as a verified figure for total spot-plus-futures demand.
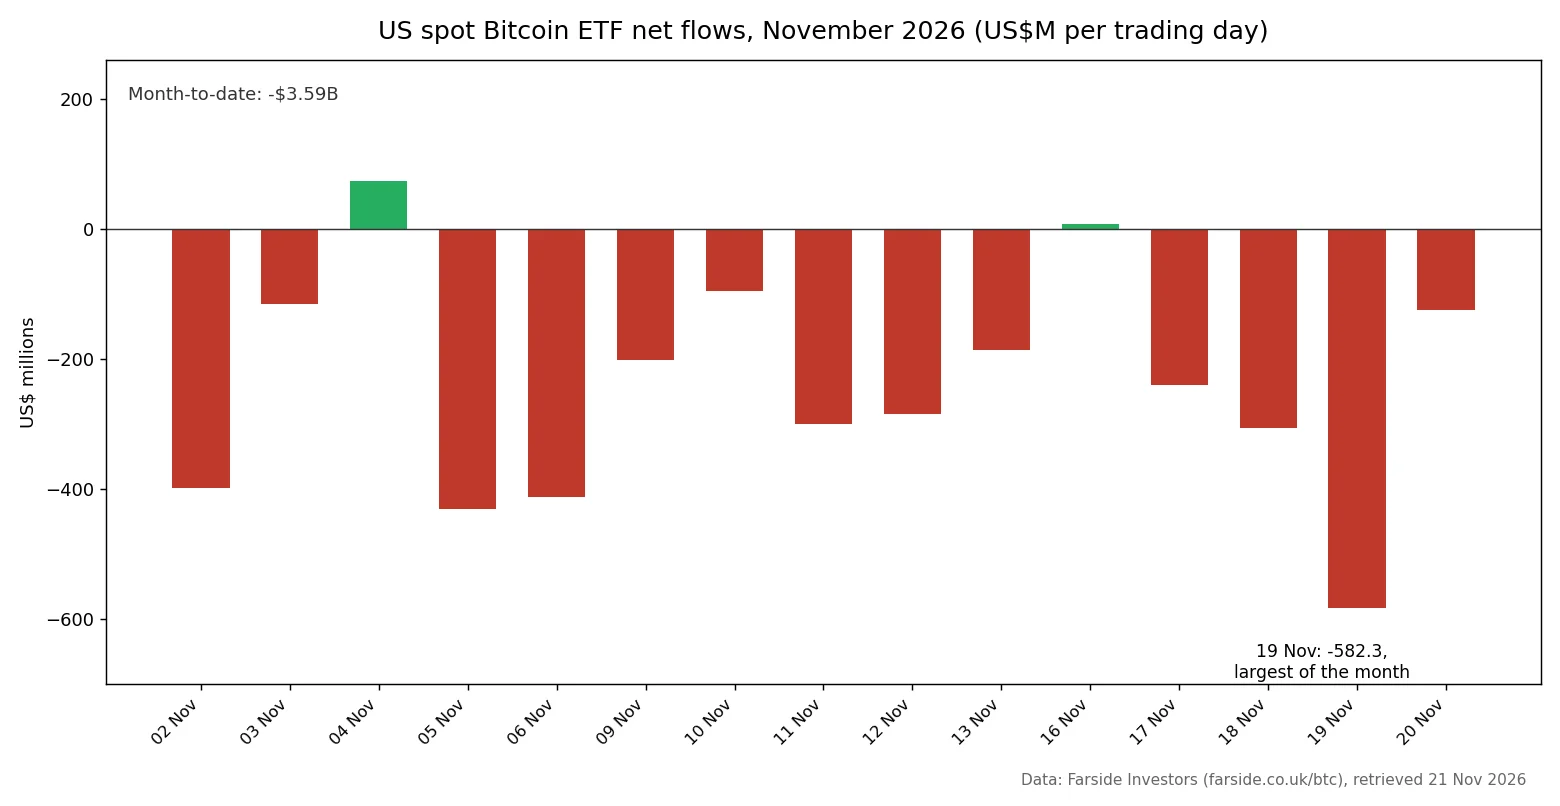
U.S. spot demand remained soft. The Coinbase Premium Index stayed negative for stretches of 30 consecutive days. US spot Bitcoin ETFs recorded net outflows on most trading days in November. On 19 November the category saw approximately $582 million in redemptions, the largest single-day outflow of the month, bringing the month-to-date total near $3.5 billion. BlackRock’s IBIT accounted for the bulk of the selling. These flows matter because earlier recoveries in this cycle were led by a visible U.S. spot bid that has not yet reappeared.
The Bull Score and the simultaneous turn
The Bull Score Index counts bullish signals across ten indicators and expresses the result on a 0-100 scale in steps of ten. Readings above 60 indicate bullish conditions; below 40 is bearish, while 40-60 is neutral. CryptoQuant reported 90 on 13 October, 20 in its 10 November research note, and a zero reading on 10 November in the later 17 November report. The latter put the score at 10. Zero means no bullish components; a score of 10 means one. The dated reports should not be treated as one continuous intraday series.
CryptoQuant’s 10 November note compared the collapse with April 2025, when the score fell to 20 following the tariff-related sell-off and recovered to 80 within about two months as price formed a local bottom. The later November report recorded a lower trough of zero and described the subsequent reading of 10 as insufficient for a sustainable recovery. That is a description of weak conditions, not proof that price cannot rebound.
Other cycle markers moved in tandem. Price lost the 365-day moving average (near $75.9K) and the 200-day moving average (near $72.9K). Those averages, which had acted as support on the way up, became resistance. Holders realized losses on a scale last seen in mid-July. The unrealized margin on recent purchases reached −20 percent, a zone historically associated with bottoming formations that have taken at least two months to complete.
Local bottom or deeper correction: the historical parallels
Contractions in apparent demand of the size seen in November 2026 (−250K to −290K BTC over 30 days) have marked local bottoms before. Similar readings appeared in March 2025 and again in June–July 2026. In those episodes the market stabilized and recovered once demand stopped contracting and spot buying re-emerged.
April 2025 offers a local-bottom comparison: the Bull Score fell to 20 and recovered to 80 within about two months. The 10 November report also identifies March 2025 and June-July 2026 as examples in which sharp apparent-demand contractions coincided with local bottoms. These precedents show that extreme weakness can accompany a bottom; they do not establish that the current decline has ended.
The alternative path is a deeper correction. CryptoQuant notes that during bull-market corrections the unrealized margin on coins held one to three months has often bottomed near −12 percent. At −20 percent the current reading has already moved beyond that typical local-bottom threshold. A sustained break further would place the move in the company of the deeper drawdowns of 2024, 2025, and early 2026. Price is also trading well below both long-term moving averages; historically, large sustained rallies have required a reclaim of those averages.
CryptoQuant identified concentrated long-term-holder selling and new-investor buying in the $62,000-65,000 band in its 17 November report, describing it as potential support. The subsequently reported 19 November close of $61,915 was already below its lower edge. It should therefore be watched as a band to reclaim, not described as an intact floor still waiting to be tested. A move back into the band and an ability to hold it would be more constructive than repeated rejection below it.
What supports or weakens Bitcoin’s valuation in this phase
Bitcoin’s valuation in any regime rests on the balance between new supply and the willingness of holders to absorb it, plus the external capital that arrives through spot markets and ETFs. In the current phase three factors are actively weakening that balance.
First, deeply negative apparent demand points to weak structural absorption of supply. Second, U.S. spot and ETF demand remain weak in the cited reports. Third, the Bull Score is near its floor: the 17 November reading of 10 means only one of its ten components was bullish. That is a weak backdrop for a sustained recovery, although it does not rule out a temporary price bounce.
A recovery would require improvement in those same areas. Apparent demand moving back toward zero would be more constructive than a continuing contraction. A sustained positive Coinbase Premium and repeated ETF inflows would point to a stronger U.S. spot bid. A Bull Score above 40 would move into the neutral range, not establish a bullish majority or confirm a new bull phase. The index would need to rise above 60 to enter its bullish range.
Near-term indicators that would raise or lower the probability of a local bottom versus a deeper correction
The reports suggest a set of indicators to watch, rather than a mechanical forecast. A local-bottom scenario would become more plausible with:
- Apparent demand contraction ending and the 30-day sum moving back toward zero, led by spot buying.
- The Coinbase Premium Index turning positive and remaining so.
- The Bull Score improving above 40 into neutral territory, with a move above 60 providing a stronger bullish signal.
- Price reclaiming and holding the $62,000-65,000 holder-activity band, followed by progress toward the long-term moving averages.
A deeper-correction scenario would be more likely if:
- Apparent demand remains deeply negative for additional weeks.
- Realized losses continue at elevated levels and the unrealized margin on recent buyers deteriorates further beyond −20 percent.
- ETF outflows persist and the Coinbase Premium stays negative.
- The Bull Score remaining near its floor while price repeatedly fails to reclaim the $62,000-65,000 band.
CryptoQuant’s Bear Claw report associates unrealized trader losses around -20 percent with historical bottoming formations that tended to take at least two months. That places the market in a zone where bottoms have formed before, but does not confirm that the decline is over.
Challenges and risks
The primary risk is that the demand contraction persists. When structural accumulation fails to absorb new issuance, price must fall until it becomes attractive enough to restart buying. Short-term holders are already carrying significant losses; further declines increase the probability of additional selling. ETF outflows remove a source of steady bid that has been important in prior recoveries. Macro factors, Fed policy stance, residual effects from earlier security incidents, and post-election positioning, remain in the background and can extend the period of soft demand.
Extreme weakness in apparent demand and the Bull Score has previously coincided with local lows. The unresolved question is whether buyers return in sufficient size to absorb supply. The $62,000-65,000 band is now a recovery test rather than an intact support assumption. A failure to reclaim it, alongside persistent demand weakness, would keep deeper downside risk in view. Neither that band nor any single indicator can establish a durable bottom.
The rapid Bull Score decline from 90 to zero illustrates how quickly cycle conditions can deteriorate. CryptoQuant notes that earlier bottoming formations associated with trader losses of this scale tended to take at least two months. That historical observation is not a minimum waiting period or a forecast for the present episode.
Recovery signals and the path ahead
The recovery case would begin with apparent demand improving toward zero, stronger spot buying, and a sustained return of U.S. demand through the Coinbase Premium and ETF flows. A Bull Score above 40 would be an improvement into neutral territory; above 60 would be the stronger bullish reading. Reclaiming the $62,000-65,000 holder-activity band would be an initial price test. The 200-day and 365-day averages, about $72,900 and $75,900 in the 17 November report, were higher resistance levels at that report date, not fixed targets or a guarantee of recovery.
Until those signals appear, the data describe a market that has re-entered a bearish phase. The simultaneous collapse in demand growth and the Bull Score is consistent with both a local bottom of the April 2025 or mid-2026 type and the opening stage of a deeper correction. The difference will be visible in the weeks ahead through the specific indicators outlined above.
For readers tracking Bitcoin’s cycle, the practical step is to watch the three leading measures, apparent demand, the Coinbase Premium / ETF flows, and the Bull Score, rather than any single price level. Those series have already told the market that the conditions for a sustained rally are not yet in place.
Subscribe to Cryptopress for deeper on-chain and market analysis: https://cryptopress.substack.com/subscribe