

On September 22, 2026, Bitcoin holders realized 25,700 BTC in profit. It was the largest single-day profit print of the year. It was also the day CryptoQuant called a new bull market.
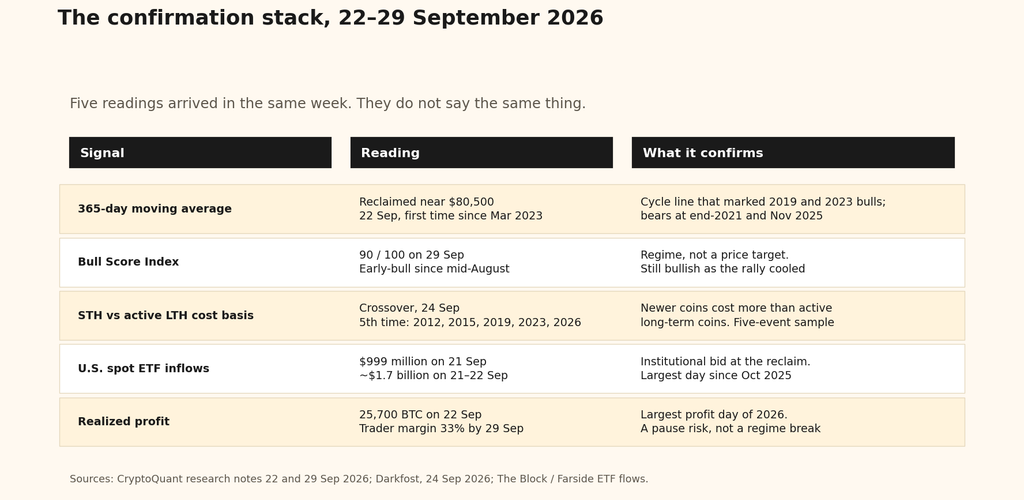
Price had closed above its 365-day moving average, then near $80,500, for the first time since March 2023, and was trading around $86,000. The day before, U.S. spot Bitcoin ETFs had taken in $999 million, the biggest session since October 6, 2025, when the funds absorbed $1.2 billion. Across September 21 and 22 the ETFs took about $1.7 billion. BlackRock’s IBIT led the Monday print. No Bitcoin fund reported a net outflow on the Tuesday that followed.
The confirmation and the selling arrived together. A cycle line that has marked the start of prior bulls was reclaimed in the same week that active holders booked the year’s largest profit, and in the same week the firm’s chief executive said this bull should not be priced like the last ones.
By October 3, Bitcoin was back in the mid-$84,000s after an eight-month high near $87,400. The October 2025 record, about $126,200, was still roughly a third above the market. The next on-chain supply cluster still sat at $88,000–$90,000. The bull call did not remove that wall. It named it.
This piece maps that distinction: what CryptoQuant confirmed, what the fifth cost-basis crossover does and does not say, why Ki Young Ju cut the expected multiple from the old 10x poster to 3–5x, and which levels separate a pause from a regime break.
What the 365-day line is for
A moving average is an average of past prices. The 365-day version is the average of the last year. Traders use shorter averages to time entries. CryptoQuant uses the yearly average as a cycle line, not a signal to click.
The firm’s record, as it states it, is short and specific. Closes above the line confirmed the bull markets of 2019 and 2023. Closes below it confirmed the bear markets at the end of 2021 and in November 2025. The September 2026 reclaim was the first since March 2023. A bounce can happen anywhere. This line has a history of separating one regime from the next.
On-chain indicators had turned first. CryptoQuant’s Bull Score Index and its Bull-Bear Market Cycle Indicator had flipped toward an early bull since at least mid-August. By the week of the reclaim the score was strongly bullish. A follow-up on September 29 still had it at 90 out of 100, even as the rally cooled. Three readings — the score, the cycle indicator, and the yearly average — pointed the same way. The firm’s line was that the alignment is stronger than any one of them.
Price had also cleared a supply wall. Through 2026, long-term holders and coins dormant for seven years or more had sold in size into the $76,000–$81,000 band. CryptoQuant’s September 22 note treated the push through that band as the removal of the heaviest nearby supply. Removal is not an empty road. The next cluster was already marked.
A useful way to hold this is to separate the line from the story told about it. The close above the last 365 days is a fact. The story is an inference from a handful of prior crosses. Two bull crosses and two bear crosses are a pattern, not a law. November 2025 is the reminder: the same line that confirmed the prior bull also confirmed its end.
The fifth crossover, and the coins left out
Two days after the reclaim, CryptoQuant analyst Darkfost flagged a second confirmation. The cost basis of short-term holders had crossed above the cost basis of active long-term holders. He counted it as the fifth time the signal had appeared, after 2012, 2015, 2019, and 2023.
Cost basis here is an estimate of the average price paid for a group of coins, built from when those coins last moved. Short-term holders are the recent buyers. They set the marginal price, because they are the cohort most likely to sell into a rally or to capitulate into a drop. In the standard split, a coin becomes long-term after about 155 days.
Darkfost’s version adds a filter that changes the result. Active long-term holders, on his chart, are coins that have moved at least once in the past seven years. Coins untouched for longer than that are left out. More than 3.5 million BTC has not moved in over ten years. That dormant stock grows by roughly 8,000 to 30,000 BTC a month, as more coins age past the threshold. Including that stock would drag the long-term cost basis down toward prices from an earlier era and make a bullish crossover easier to print.
The logic of the signal is simple once the filter is clear. When newer coins carry a higher average acquisition price than the coins still in active long-term hands, the recent buyer is no longer the underwater cohort. Fresh capital has paid up relative to the holders who are still participating. That is what a bullish crossover is trying to see.
Darkfost was explicit about the limit, and the limit belongs in the sentence. Five occurrences is a small sample. He had flagged a related end-of-bear signal on July 11 and treated the September cross as confirmation of that turn, while writing that there is always a margin of error. A five-event series can fail. It is a description of structure, not a calendar for the top. ETF inflows are part of why the cross can print without a retail mania. That is a different buyer from 2017, and it is why the same crossover can mean a bull regime without meaning a 10x.
The wall at $88,000–$90,000
The path CryptoQuant described between roughly $86,000 and the next resistance was “largely clear.” The resistance was not.
The realized price of coins that last moved on-chain between one and three months ago — a proxy for the active trader — sat near $64,300. Around that level the firm draws bands for profit and loss. The upper band, about 40 percent above the trader realized price, sat near $90,300. That band lines up with an on-chain supply cluster at $88,000–$90,000, and with the realized prices of several intermediate holder cohorts in the same neighborhood. A separate age-band reading later in the month put the 1-to-4-week cost basis near $78,300, the 1-to-3-month cohort near $66,300, and the 3-to-6-month cohort near $72,300, with spot above all three. Short-term holders were in profit. The youngest cohort sitting above the older short-term cohorts is what a healthy trend looks like on that chart. It is also why those holders can sell without taking a loss.
By September 29 the unrealized profit margin of on-chain traders had reached 33 percent, the highest since December 2024. Holders had already realized 25,700 BTC on the confirmation day. Comparable margins have historically pulled supply onto the market. CryptoQuant’s language for $90,000 was a natural pause inside an uptrend, not a reversal — provided price held the reclaimed average. Head of research Julio Moreno kept the bull-market label on the same note that flagged fatigue. Both statements can be true. A regime can be intact while the easy part of the move is over.
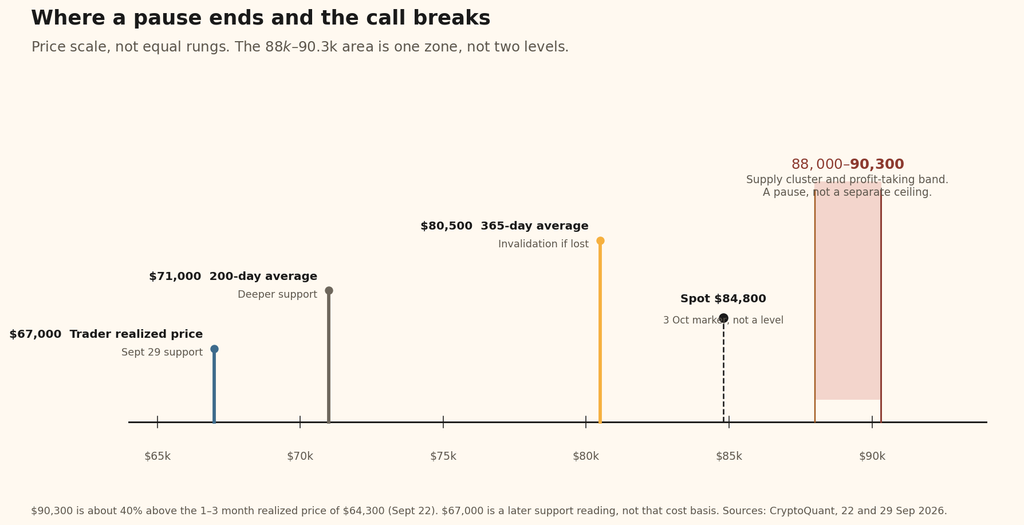
If the average does not hold, the map is already drawn. First support is the 365-day line near $80,000. Below that, the 200-day average near $71,000, then the traders’ on-chain realized price near $67,000. A dip into that band is a correction inside the call. A sustained loss of the yearly average is the call breaking, the same way November 2025 broke the prior one.
What the old cycles actually paid
The multiples have already been shrinking. That is the backdrop to Ju’s revision, not a slogan about maturity.
From the 2015 low near $152 to the 2017 peak near $19,800 was on the order of 130 times, followed by a drawdown of about 84 percent. From the 2018 low near $3,100 to the 2021 peak near $69,000 was about 22 times, then a drop of roughly 77 percent. From the 2022 low near $15,500 to the October 2025 high near $126,200 was about 8 times, then a drawdown on the order of 54 percent into the 2026 lows.
Each peak required more capital for less multiple. Ju had argued over the summer that the 2022–2025 cycle needed on the order of $700 billion of realized-cap growth to produce a gain of several hundred percent. Realized cap is the aggregate cost basis of the supply: coins reprice to the market only when they move, so a rising realized cap means new money paid a new price, not that old coins were marked up on a screen. A larger realized cap is a heavier object. Moving it by another 10x takes a buyer who does not exist in the old cycle’s size.
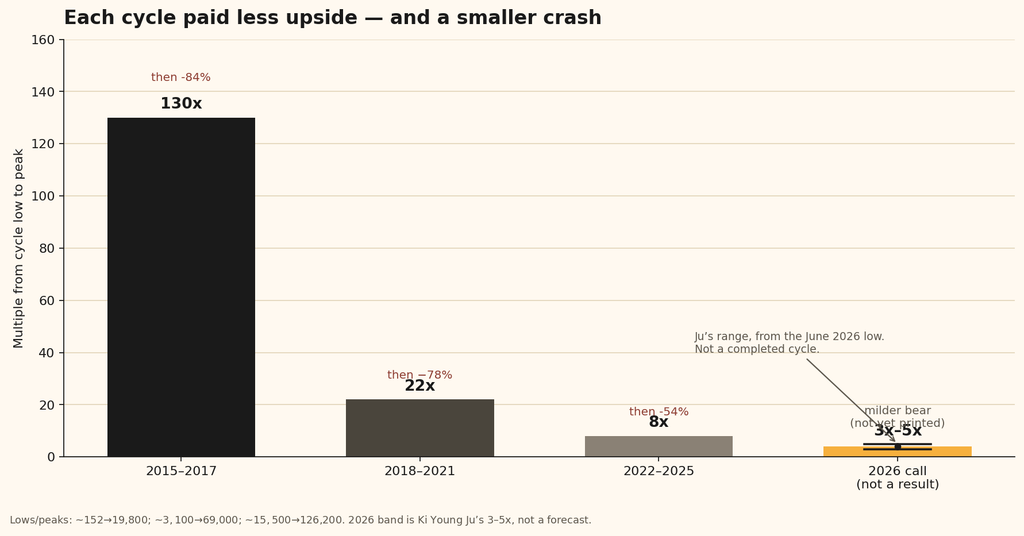
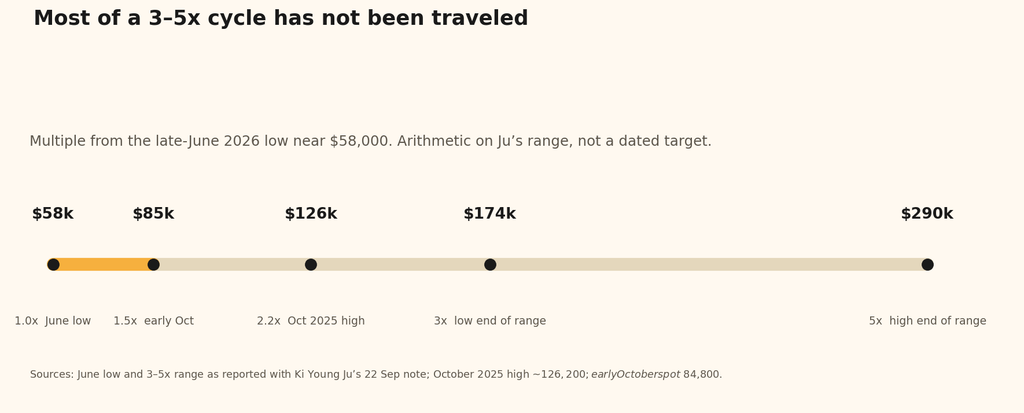
The 2026 range is measured from the late-June low near $58,000. On that base, 3x is roughly $174,000 and 5x is roughly $290,000. The October 2025 record is only a little over 2x from that low. Early October’s mid-$84,000s is about 1.5x. Most of a 3–5x path, if it is the right path, has not been traveled. Most of a 10x path is what the ownership structure is being asked to stop paying for.
The arithmetic is a range applied to a printed low. It is not a forecast with a date. A 3x from $58,000 that stalls at the old high would be a failed reading of the call. A move through $126,000 that fades before $174,000 would be the low end arriving early. Neither is knowable from a September crossover.
Why a 3–5x cycle is worth that range
The question is not whether Bitcoin can print a higher price. It is why the multiple attached to this regime should be smaller than the poster on the wall, and what would make that smaller multiple the wrong frame.
Ki Young Ju is the founder and chief executive of CryptoQuant, the Seoul firm whose charts this piece is using. He studied industrial and management engineering at POSTECH, worked in cybersecurity at Penta Security, and started the company in 2018 after reading the Bitcoin white paper as an exchange student at the University of Waterloo. CryptoQuant sells on-chain data — exchange flows, miner activity, holder cost basis — to trading desks and institutions. Ju is the public voice of that data, with a few hundred thousand followers on X and a habit of saying the call out loud, including when he later revises it. The 3–5x note is one of those revisions. It is his reading of his own firm’s numbers, not a research-note consensus.
Ki Young Ju’s answer is ownership. When Bitcoin was smaller and retail-dominated, hot money produced the vertical rallies and the 80 percent crashes. A larger market, and a growing share held through ETFs, custodians, and balance sheets, dampens both extremes. The same force that caps the upside softens the downside. He wrote that giving up the 10x parabola also means giving up the 80 percent crash, and that this trade-off is what invites patient capital. In an early-October interview he put the liquidity pipe on ETF and custody flows, put the institutional bull-bear line at the ETF cost basis in the low-to-mid $80,000s, and said overheating should be read from behavior — large holders sending coins to exchanges, retail rushing in — not from a round number.
Four on-chain facts are doing the work in that argument.
First, MVRV — market value divided by the average on-chain cost basis — never fell below 1 in this drawdown. Some investors took losses. Holders as a group did not go underwater. In 2015, 2018, and 2022, the average holder did. A bear market that never puts the aggregate holder below cost is a shallower bear. Shallower bears have less panic supply to squeeze on the way up, which is one mechanical reason the next rally can be smaller.
Second, realized cap was rising into and through the turn. That is fresh capital, not a squeeze of existing coins. Ju has described realized cap near $700 billion and argued the next cycle is denominated in trillions if the asset keeps absorbing institutional balance sheets. A trillion-dollar cost basis does not 10x because a forum got excited.
Third, older whales had stopped distributing, after spending much of the prior year selling into strength. Distribution from coins older than seven years was exactly the supply that built the $76,000–$81,000 wall. A halt in that selling removes a seller. It does not create a buyer. The ETF print is the candidate for the buyer.
Fourth, futures whales had built large long positions near the lows, and the slower 365-day average of the PnL Index — aggregate holder profitability — was inflecting after lagging at the turn, as it usually does. Profitability bottoms forming at higher levels are the chart version of “less extreme.”
What weakens the 3–5x frame is the same list, read the other way. If ETF flows reverse and stay reversed, the institutional dampener is a slogan. If OG coins resume the distribution that built the last wall, the supply picture of September is stale. If MVRV does go below 1, the “holders never went underwater” fact is no longer a fact about this cycle. If the yearly average is lost, the regime call and the multiple call fail together.
None of this is a ceiling. Ju said so in the same post. A 5x from $58,000 is a price near $290,000 and a market value, at current supply, on the order of several trillion dollars. That is a different asset in a portfolio from a coin that tops out by revisiting $126,000. It is simply not the asset the 2017 poster described.
What would raise or lower the call from here
The near-term tells are already on the map. They are not new indicators. They are the same ones that confirmed the turn, watched for a break.
The call gets stronger if price clears $88,000–$90,000 and holds it, with realized cap still rising and ETF inflows that do not reverse the following week. A wick into the profit band, followed by another 25,000 BTC profit day and a flat ETF tape, is the pause CryptoQuant already priced. A clearance that absorbs that profit day is the version in which the wall was supply, not a ceiling. A Bull Score of 90 with rising profit margins is a young bull getting tired. A score rolling over as the yearly average is tested is a different message.
The call gets weaker if the 365-day average is lost on a closing basis and the Bull Score falls with it. That is the invalidation the firm’s own history points to. A wick below the average is noise. A week below it, with the ETF cost basis in the low-to-mid $80,000s also given up, is the institutional line and the cycle line failing in the same neighborhood. Below that, $71,000 and $67,000 are supports inside a correction only if the regime call is still being given the benefit of the doubt.
Behavioral tells sit beside the levels. Ju’s checklist for a top is large holders sending coins to exchanges, and a rush of new retail, not a price. The September 22 print is a smaller version of the first tell. It stalled a young bull. It did not end one. One day of 25,700 BTC is a wall. A month of days like it, without ETF absorption, is distribution.
The fifth crossover has its own failure mode. If short-term cost basis falls back under the active long-term cost basis, the September cross joins the signals that printed and faded. Five events do not become six just because the fifth was wanted.
Macro sits outside the on-chain map and can still dominate it. The September bid arrived with a broader return of risk appetite, not with a Bitcoin-only catalyst. A rates shock or an equity drawdown would lower the call without falsifying the September arithmetic. The on-chain map tells you whether the regime survived the shock. It does not tell you the shock will not come.
What a moderated bull does to a portfolio
A 3–5x cycle with a milder bear is a different product from a 10x cycle with an 80 percent crash. The first rewards staying invested and sizing for a grind. The second rewards lottery tickets and the nerve to sell them. Most of the damage in prior cycles was not missing the top. It was sizing for a parabola and then meeting the crash that paid for it.
Size for the trade-off, not the old poster. A portfolio built to catch a 10x will overtrade every pause at $90,000. A portfolio built for 3–5x from the lows can treat the $88,000–$90,000 band as supply to expect. The invalidation is the 365-day average, not a red week.
Treat the institutional line as a level. The ETF cost basis in the low-to-mid $80,000s sits on top of the yearly average. Two kinds of capital are watching the same neighborhood. If they leave together, the dampener argument is the thing that failed.
Read the top in behavior, and read it slowly. One profit day is not a top. A cluster of them, plus exchange inflows from old coins, plus a retail rush into a vertical week, is the checklist Ju actually gave. Until that cluster exists, the September fatigue is a pause inside a confirmation.
The risk that the frame is early
The honest risk is not that the signals are imaginary. The reclaim happened. The cost-basis cross happened. The profit print happened. The risk is that a confirmation of regime is being asked to carry a forecast of magnitude.
Ju’s 3–5x is an expectation about market structure: a larger realized cap, a buyer base that includes ETFs, a bear that never put aggregate holders underwater. It is not a model with an error bar. Completed cycles support the direction of the claim — multiples and drawdowns have both compressed — and do not support a precise band. Eight times from the 2022 low was itself a compression from 22 times. The next step could be 5 times, or 3, or a failed retest of the old high. September’s data pick the regime. They do not pick the multiple inside it.
There is a second risk inside the sample. The fifth crossover excludes more than 3.5 million dormant coins on purpose. That is the right exclusion if those coins are lost or indifferent. It is the wrong exclusion if a slice of them moves. The $76,000–$81,000 wall was built by old coins that did move. The filter is a method. It is not a promise that the next old coin stays still.
A third risk is time. The four-year rhythm is still a useful reference because the halving still slows new supply and miner costs still set a floor. A useful reference is not a schedule. The November 2025 break of the yearly average already showed that this cycle does not need a halving anniversary to change regime. It needs a close on the wrong side of a line the market has agreed to watch.
What the September data can support
A moderated bull is not a small event. From a $58,000 low, 3x is a new all-time high by a wide margin, and 5x is a different asset in portfolio terms. It is not the asset the old cycle posters described, and it is not “Bitcoin has topped” either. The distance between those two misreadings is the point of the map.
The September data said the direction had changed: yearly average reclaimed, score already bullish, fifth cost-basis cross, ETF bid measured in billions over two days, old supply at $76,000–$81,000 cleared. The same week’s profit-taking, and the chief executive’s own revision, said the magnitude had changed with it. The next test is narrower than the argument. Either $88,000–$90,000 is absorbed, or the yearly average is given back. One of those is a pause. The other is the confirmation, undone by the same line that made it.
This is not investment advice. On-chain signals confirm regimes. They do not schedule tops, and they do not size a position.
If this kind of market-structure note is useful, the longer pieces live on Cryptopress. Subscribe at https://cryptopress.substack.com/subscribe.