


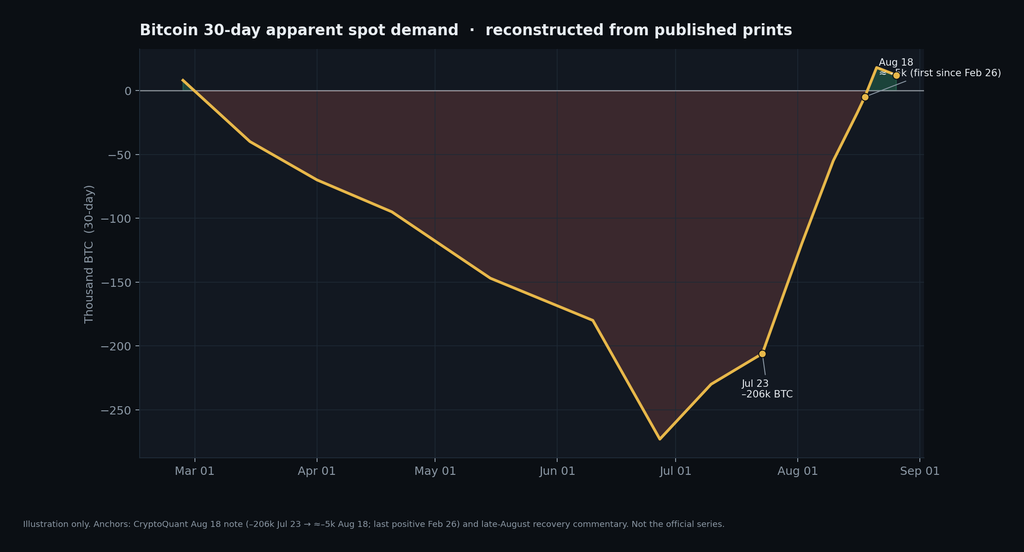
On July 23, Bitcoin’s 30-day apparent spot demand sat at roughly –206,000 BTC. That is not a soft reading. It means the market was absorbing far less coin than miners were issuing and old holders were reactivating. Price was stuck in the low $60,000s. The tape felt empty.
Three weeks later the same metric was hugging zero — about –5,000 BTC — for the first time since February 26, 2026. By the last week of August, CryptoQuant’s demand-to-issuance ratio had spent six straight days above 1, last printed at 2.52, after touching 3.16 on August 21. The July low on that ratio was –6.93. Direction flipped. Magnitude did not.
Price did the loud part. From August 17 to the August 25 high near $80,000–$81,200, Bitcoin rallied about 24%. CryptoQuant’s Bull Score jumped from 30 to 80 in a week — the most bullish print since October 6, 2025, when Bitcoin last traded around $124,000. Eight of ten inputs in that score are now green. That is a regime change on a dashboard. It is not yet a confirmed bull market.
The useful question is narrower: when spot demand crosses from contraction into expansion, what has price usually done next — and what is already overheating?
What “apparent spot demand” actually measures
Apparent demand is an accounting identity, not a sentiment poll.
Over a rolling window (CryptoQuant uses 30 days), you compare:
- new coins from issuance, plus
- older coins coming back to life,
against the coins that leave exchanges, go dormant, or otherwise get taken off the liquid float.
A negative reading means more Bitcoin is being offered than the spot market is absorbing. A positive reading means buyers are taking down more than the network is adding and unlocking. The zero line is the regime switch.
That is why the metric stayed ugly for so long this year. Apparent demand spent most of 2026 in the red, with prints near –147,000 BTC in May and a long stretch of consecutive negative days earlier in the summer. Price could bounce on leverage. The float was still leaking.
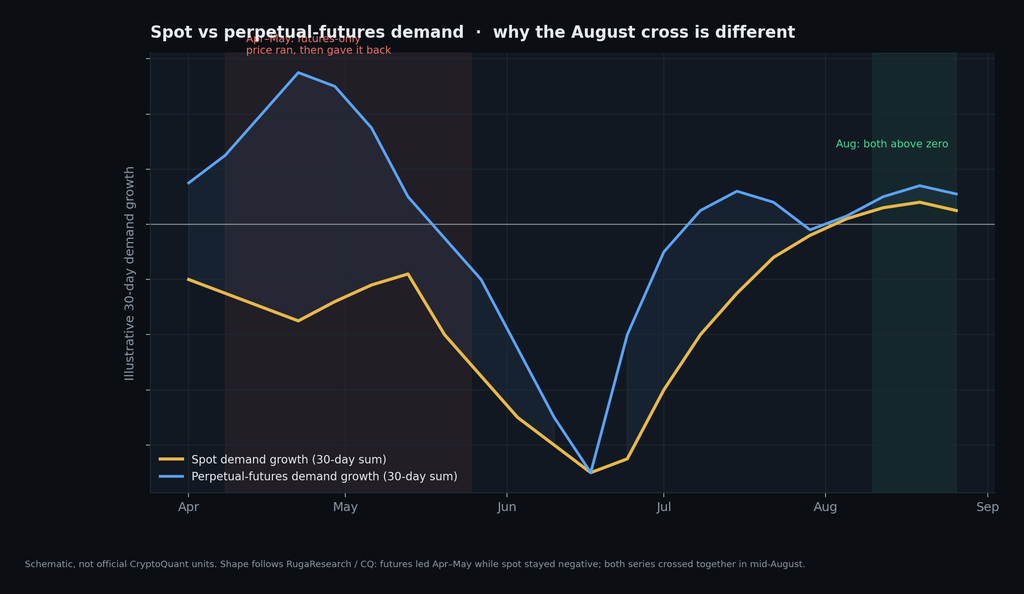
One more distinction matters. CryptoQuant separates spot apparent demand from perpetual-futures demand. The first is coins changing hands for keeps. The second is positioning. They do not have the same forward record.
Why the spot zero-cross is the signal that has worked
CryptoQuant’s August 18 note is the cleanest statement of the historical test.
When 30-day apparent spot demand crosses from negative to positive — using independent, de-clustered events — Bitcoin’s median move over the next 60 days has been +18.1%, with a 78% win rate.
The same zero-cross in perpetual-futures demand has almost no edge: medians near zero, win rates around 48–57%. Leverage can lift the print. It has not been the thing that holds the print.
That is the entire argument for caring about this particular flip and ignoring a dozen other “demand” headlines.
April and May already ran the experiment in reverse. Futures demand went sharply positive while spot stayed negative. Price ran from roughly $70,000 toward $82,000, then gave the move back in June when futures demand printed its deepest negative on that chart. Spot never confirmed. The rally did not keep the level.
This time both series turned together — the first simultaneous expansion since early October 2025. That is better structure than a pure squeeze. It is still a shallow cross. A 30-day sum that just cleared zero can fall back through it in a week. Persistence is the confirmation, not the first green print.
Valuation is why the historical hit rate jumps to 87%
The same study splits the sample by valuation regime.
Spot demand cross-ups that fire while MVRV sits below its 365-day moving average have delivered a +23.3% median over 60 days and an 87% win rate. That was the setup CryptoQuant described in mid-August.
MVRV — market value divided by realized value — is the market’s average multiple over the aggregate on-chain cost basis. When it is depressed relative to its own one-year average, new spot buying is arriving into cheap coins, not into a crowd that is already up several times its cost.
The ratio itself is no longer at the summer floor. Daily snapshots around August 25 put headline MVRV near 1.49, after a lift from the mid-1.2s during the rebound. That is “fair,” not capitulation. Long-term-holder MVRV had been grinding toward 1.24–1.28 earlier in the summer — stressed, not broken. The bear-valuation condition that powered the 87% bucket was the relationship to the 365-day MVRV average, not a reading under 1.0.
Treat the 87% figure as a conditional historical rate on a small set of independent events, which is exactly how CryptoQuant labeled it: a tailwind, not a guarantee, and only after the demand turn actually completes.
| Setup | Median 60-day move | Win rate |
|---|---|---|
| Spot demand crosses above zero | +18.1% | 78% |
| Same cross while MVRV is below its 365-day average | +23.3% | 87% |
| Perpetual-futures demand crosses above zero | ~0% | 48–57% |
Source: CryptoQuant, August 18, 2026 research note. De-clustered historical events. Sample is limited.
The rally, the Bull Score, and the line that still matters: $83,000
The price path is simple.
- August 16–17: Bitcoin around $63,000–$64,500.
- August 19–21: the vertical part of the move, through $69,000, $73,000, then $78,000.
- August 25: session high above $81,000.
- August 26: back near $78,000–$79,000.
That is a squeeze plus a demand impulse, not a slow grind. Coinbase data from the same week showed the 30-period outflow average exploding as coins left the exchange during the lift — the spot footprint of the move, not just perpetual volume. US spot Bitcoin ETFs added about $1.92 billion in the week ending August 21, with all five sessions positive. That is real bid, even if it is not yet a new structural wave.
CryptoQuant’s August 25 regime note went further than the demand study. Julio Moreno, head of research, called it the initial phase of a new bull market: valuation, demand, and liquidity had switched. The Bull Score’s leap from 30 to 80 is the summary statistic. Eight of ten components are bullish. Apparent spot demand is expanding at its fastest monthly pace since late December.
The firm still withholds the official stamp.
Historically, CryptoQuant treats a close above the 365-day moving average as the cycle divider — bull markets when price crosses up, bear markets when it crosses down. That average sits near $83,000–$83,100. Price closed the recent push about 5% below it. Until a decisive close above $83,000, that line is resistance, and an early-bull correction remains on the table.
Two macro headlines sat under the bid: the US Treasury saying it will lift long-term bond buybacks to at least $4 billion per operation from September 9, and a political hint that the US government might consider buying Bitcoin. Markets can reprice those stories in a session. They cannot replace a weekly close through the 365-day average.
The other half of the tape: the move is already short-term hot
A demand turn and an overheated tape can exist on the same day. That is the current market.
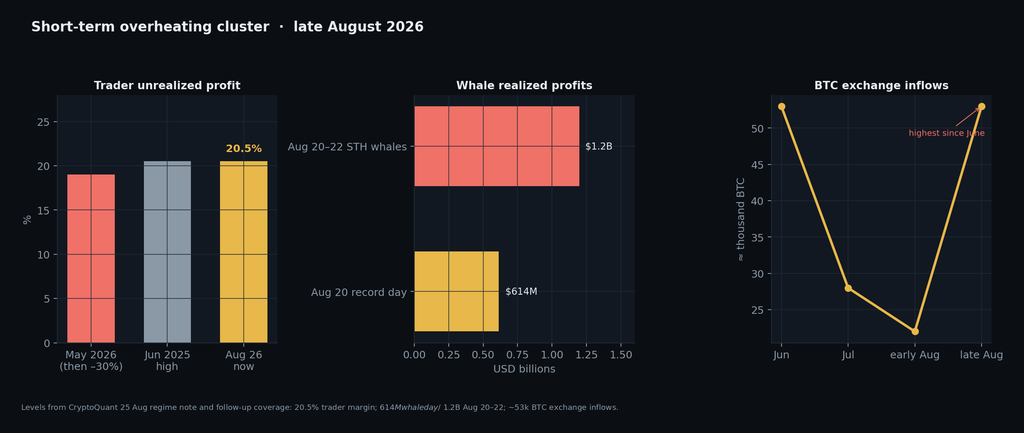
Trader unrealized profit jumped to 20.5%, the highest since June 2025. CryptoQuant has already flagged what that print did last time: Bitcoin fell about 30% after the metric reached 19% in early May, when price was near $82,000. The level is a warning about distribution risk among fast money, not a prophecy.
Whales took the offer. Short-term-holder whales realized roughly $1.2 billion between August 20 and 22, including a record $614 million on August 20 alone. That is the textbook response to a vertical 24% rip: coins that sat through the $60,000s coming up for air.
Exchange inflows rose. Bitcoin inflows printed around 53,000 BTC, the highest since June. ETH and XRP inflows rose with them. Coins moving onto venues are not automatically sold. They are newly available to be sold. That is the distinction that matters for the next two to four weeks.
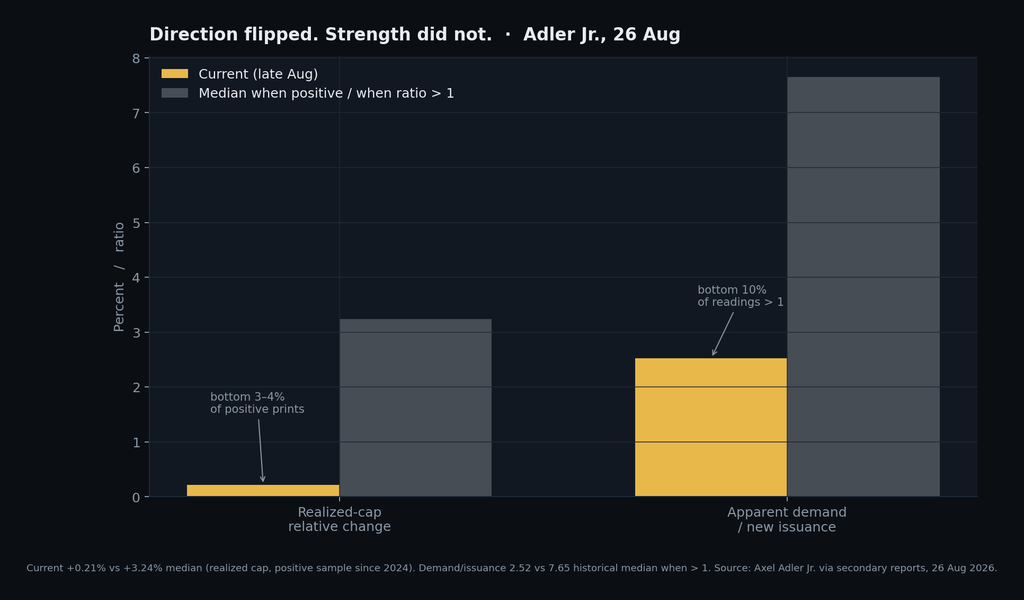
Axel Adler Jr.’s August 26 update is the sobriety check on the demand side itself. Realized-cap relative change finally turned positive at +0.21% — first green since late May — and the 30-day demand/issuance ratio is above 1. Both are still weak in absolute terms. Among positive realized-cap readings since 2024, the median is +3.24%; +0.21% sits in the bottom 3–4%. When the demand ratio is above 1, the historical median is 7.65; 2.52 sits in the bottom 10%. The direction changed. The cycle-strength reading has not.
That is the honest frame: a regime shift, not a regime that is already strong.
How to read the next 60 days without turning history into a forecast
History’s 78% and 87% figures are useful only if you keep CryptoQuant’s own caveat in front of them. The events were de-clustered. The sample is small. A demand turn is a tailwind after it completes, not a timer that starts the day a chart kisses zero.
What is actually testable from here:
- Does 30-day apparent spot demand stay positive? A one-week dip back below zero would put this print in the “failed cross” bucket, which is how several mid-cycle head-fakes have died.
- Does the demand/issuance ratio expand past the bottom decile? A move from 2.5 toward the historical median near 7 would mean buyers are doing more than covering issuance.
- Does realized-cap change hold above zero and thicken? +0.21% is a flicker. Sustained positive realized cap is capital entering the asset, not just price marking up existing coins.
- Does price accept above the 365-day average near $83,000? That is CryptoQuant’s official confirmation line. Until then, $83,000 is the ceiling of the “initial phase.”
- Do exchange inflows and whale realizations fade, or do they accelerate into weakness? Profit-taking into a bid is healthy. Profit-taking into a stalled bid is how 20% trader margins mean-revert.
Spot demand leading futures is the structural improvement versus April–May. ETF inflows and Coinbase outflows say some of the bid is cash, not just open interest. The overheating cluster says the first pause is allowed — even likely — without killing the regime call.
None of that requires a price target. The 60-day historical median from a completed spot cross, from current levels, is a range around the mid-$90,000s if the +18% analog holds, or higher if the depressed-MVRV analog holds. Those are reference points from prior events, not a map of September.
Conclusion
Bitcoin did not invent a new cycle because it tagged $80,000. It changed the sign on the one demand series that has actually preceded 60-day gains.
Apparent spot demand crawled out of a –206,000 BTC hole. Spot and futures demand expanded together for the first time since October 2025. The Bull Score went from washed-out to 80. MVRV is no longer crushed, but the cross occurred while valuations were still cheap versus their one-year baseline — the bucket with the 87% historical hit rate.
The same week produced a 20.5% trader profit margin, a $614 million whale realization day, and the largest Bitcoin exchange inflow since June. That is how early regime shifts look: the slow metric turns, the fast money overshoots, and the 365-day average at $83,000 sits there as the adult in the room.
Watch whether spot demand stays above zero. Watch whether $83,000 becomes support instead of rejection. Everything else is commentary on a one-week squeeze.
Subscribe for more on-chain and market structure pieces at https://cryptopress.substack.com/subscribe.
This is not financial advice. On-chain history is a small sample dressed in clean percentages.